- In this lab we simulated evolution and natural selection through the process of feeding and reproduction. We had the population split evenly among three different phenotype and had the different groups feed and gain as much cork as possible to simulate feeding. After the birds who gained enough food survived they reproduced and created a second generation which continued the process of feeding and reproduction.
- Pinchers were the best phenotype at capturing food because they had the use of there oposable thumbs and were allowed to reproduce the most. Contradictory to these results, knucklers continued to reproduce the most and had the largest population due to sexual selection, in which people were more likely to mate with knucklers rather then pinchers despite the data and phenotypic advantages.
- The population evolved from natural selection because of a change in allele frequency. After the first round, the allele frequency changed greatly in that the A gene dropped in percentage while the a gene rose, showing a change that fit the pattern of phenotypes and how they work in the lab. The percentage of A gene started as 52%, while a gene was at 48%. After the first round, the A gene dropped to 31%, while a gene rose to 69%. After this round, the ratio stated constant and the a gene greatly outnumbered the A gene. This shows how the population evolved quickly and that there was a change in allele frequency.
- The random events that occurred in this lab were sexual reproduction, the food placement, and the method in which mates were chosen. The non-random events included where people were placed on the line towards the food and phenotype of every bird. These random events had a large effect on the evolution of the population since mating was random and not chosen based upon successful phenotypes, which allowed unsuccessful genotypes to live through sexual reproduction, which slowed evolution of the gene pool. Food placement also affected evolution since individuals closer to food piles survived and gained more food through sheer luck, so natural selection was unable to take place.
- If the food was larger or smaller, the results would have been different because the different phenotypes would have to adjust to this change, so the data would change based on which phenotype was best suited. If the food became smaller, chances are that the pinchers would be best adapted due to there maneuverability, while stumpys would adjust to larger foods best. This would change the data, as the Stumpys became endangered with the current food size. This is similar to nature in which natural events change the availability of food, so animals must adapt to new foods, which allows the population and gene pool to evolve.
- If there was no incomplete dominance, the results would be different since knuklers would become stumpys with a higher chance of reproducing, so the population would not evolve due to the stumpys continuously living.
- Natural selection acts on the phenotypes of individuals, and in turn changes there genotype and decides weather they will survive. This alters the frequency of this genotype in the gene pool, which is evolution, the change of gene frequency in a population.
- Some strategies that individuals adopted included mating with exclusively pinchers or by having a very aggressive approach to mating. Pinchers had the best equipped phenotype, so only mating with them increased your chance of survival and created offspring that could survive.This relates to nature, where certain individuals only mate with those who have the best traits for survival rather than sexual reproduction, which change the gene frequency and selectively breeds to evolve the population.
- In evolution, populations evolve, and the frequency of alleles changes. Natural selection acts on the phenotypes, but through acting on the phenotype changes the genotypic frequency for the population.

Showing posts with label Lab Analysis. Show all posts
Showing posts with label Lab Analysis. Show all posts
Wednesday, March 16, 2016
Hunger Games Lab Analysis


Saturday, March 5, 2016
Bird Beak Lab Analysis
In part one of our lab, our claim was that "Individuals with better traits leave more offspring". The evidence of this occurrence is that the tweezer and spoon had 22 and 23 chicks respectively (shown on graph), while the scissors only had 14 chicks. This is because the tweezers and spoon were easier to use with the given materials and thus were the better trait, allowing them to leave more offspring.
Another claim of ours was that "Populations begin to look more like winners."The evidence of this occurrence is that the tweezer and spoon had 39% and 37% of the population, while the spoon only had 24% of the population. This is because the tweezers and spoon were the "winners" in terms of the amount of chicks they had and the quality of their traits were better then that of the scissors. This increase in the amount of chicks allows them to have a larger amount of the population and thus, the population reflects them.

In part two of this lab, we asked the question of "If natural selection occurs in a population, how do changes in selective pressures affect the evolution of that species?" Our hypothesis was that if natural selection occurs within a population and selective pressure mainly effects traits that are not suited for it, then only the traits that are suited to survive a certain selective pressure will continue the process of evolution. The scenario assigned to us was that we were only able to use 1/4th of our food source, which made food very scarce and allowed instruments that pick up large amounts at a time to survive. Our claim was correct since the tweezers and spoon were able to intake large quantities at a rapid pace, with a respective 12 and 11 chicks born between the two. On the other hand, the scissors, which take time to gain food, were unable to compensate in either loading capabilities of speed, and thus only had 7 chicks. This result is likely caused by how the traits adapted to the selective pressures, and those that were less suited had a lower chance of survival.
While our hypothesis was supported by the data, there have been errors due to first, the uneven partition of our food supply, and second, the differences in the techniques for using certain beaks. The cause of the uneven food partition was human error, as we partitioned it through the eye test rather than quantitatively partition it, which may have allowed for a wrong amount of food to be used in the test. This could have effected the number of chicks hatched and changed the effect of the selective pressure itself. The cause of the difference in technique was also human error. One example of this was the spoon, which was used by some to push food against a wall and collect it, which was easier that outright collecting food. The effect of this was that the number of chicks hatched for the spoon may have been altered due to an illegal advantage. Some solutions to these problems include using a scale or another type of quantitative measurement and to clarify instructions over the usage of the different beaks.

This lab was done to demonstrate the process of natural selection and two of Darwin's main principles, which are that individuals with better traits leave more offspring, and that populations begin to look more like winners. From this process I learned how different traits survive in a population, which helps me understand the concept of natural selection, where only certain traits are able to survive selective pressures and control the majority of the population. This relates back to the vodcast called "change, its all natural" where we learned about the basics of Darwin's conclusions and to 7th grade science, where we learned the concept of natural selection, but never experienced a life like example of it. based on my experience from this lab, I know how to create an experiment through the use of competition and how to change variables but still keep the same principle concepts.
Another claim of ours was that "Populations begin to look more like winners."The evidence of this occurrence is that the tweezer and spoon had 39% and 37% of the population, while the spoon only had 24% of the population. This is because the tweezers and spoon were the "winners" in terms of the amount of chicks they had and the quality of their traits were better then that of the scissors. This increase in the amount of chicks allows them to have a larger amount of the population and thus, the population reflects them.

While our hypothesis was supported by the data, there have been errors due to first, the uneven partition of our food supply, and second, the differences in the techniques for using certain beaks. The cause of the uneven food partition was human error, as we partitioned it through the eye test rather than quantitatively partition it, which may have allowed for a wrong amount of food to be used in the test. This could have effected the number of chicks hatched and changed the effect of the selective pressure itself. The cause of the difference in technique was also human error. One example of this was the spoon, which was used by some to push food against a wall and collect it, which was easier that outright collecting food. The effect of this was that the number of chicks hatched for the spoon may have been altered due to an illegal advantage. Some solutions to these problems include using a scale or another type of quantitative measurement and to clarify instructions over the usage of the different beaks.
Friday, January 22, 2016
pGLO Lab Analysis
pGLO Observations , Data Recording & Analysis
1.
|
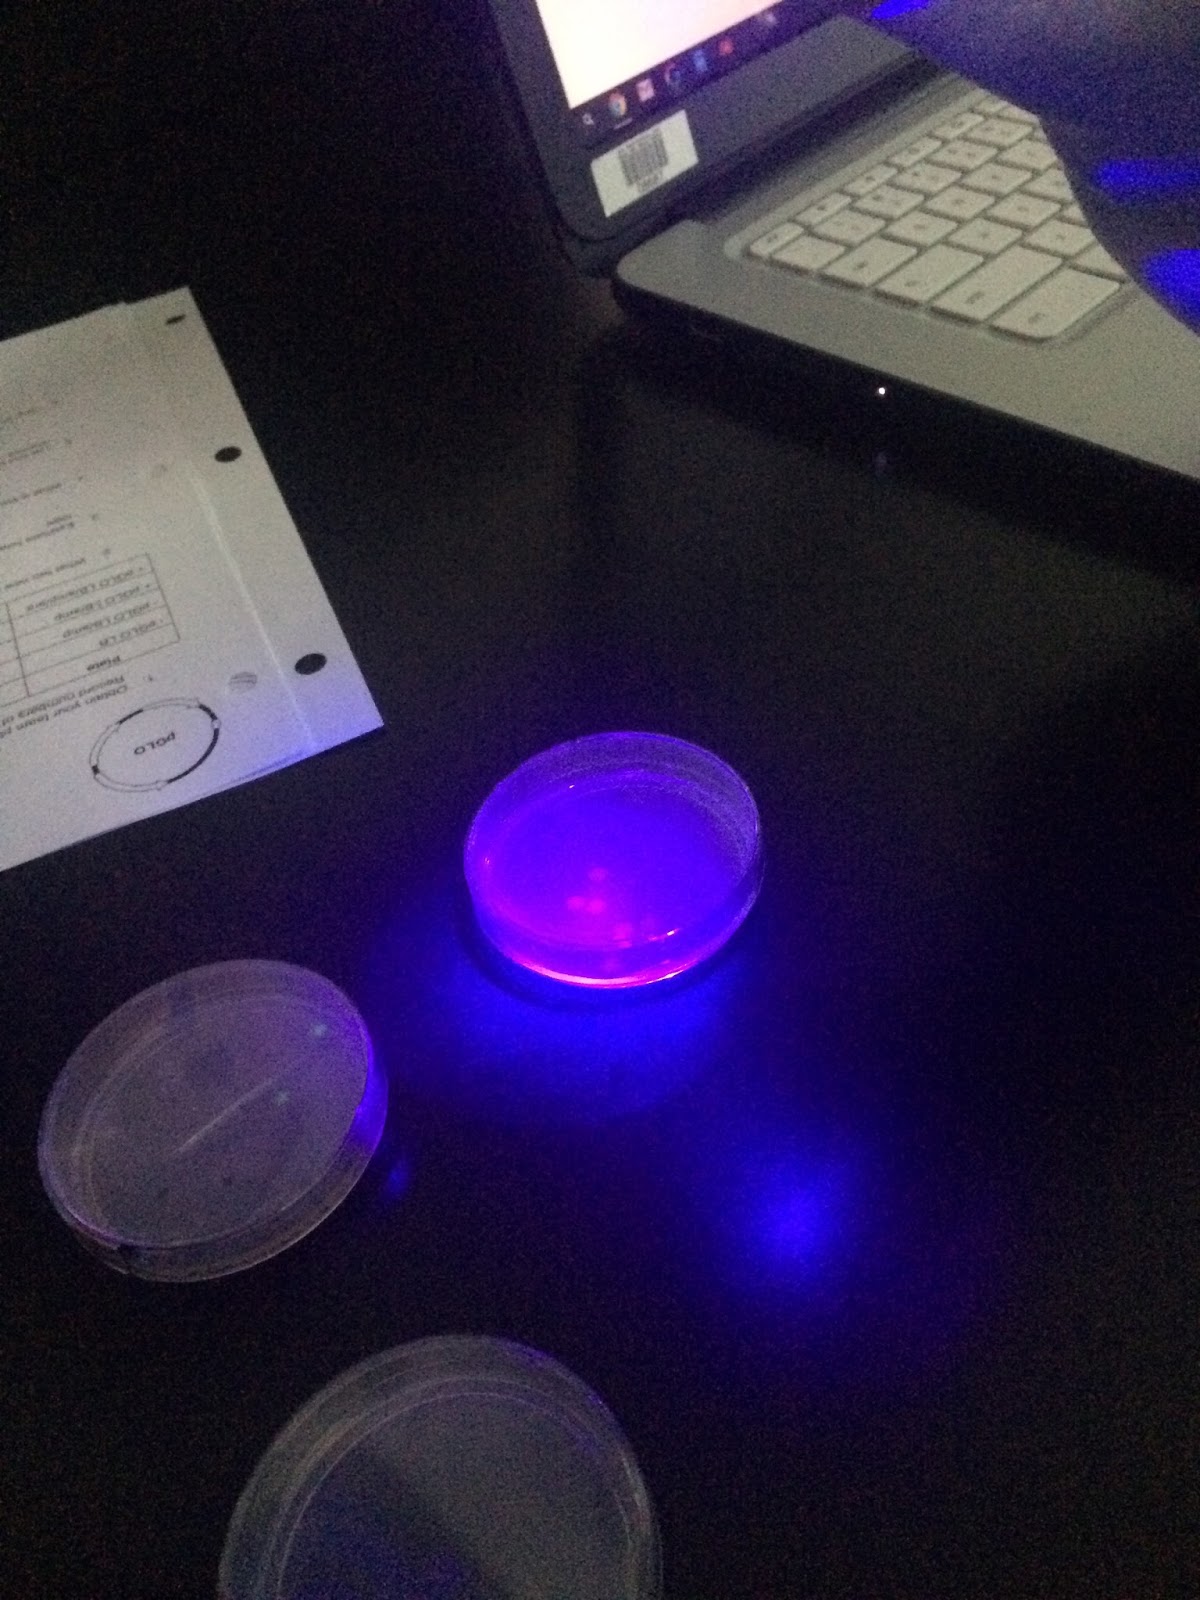
Obtain your team plates. Observe your set of “+pGLO” plates under room light and with UV light. Record numbers of colonies and color of colonies. Fill in the table below.
|
2.
|
What two new traits do your transformed bacteria have?
| |
The two traits that the transformed bacteria have are resistance to the antibiotic ampicillin, and the inclusion of the GFP gene in the bacteria.
| ||
3.
|
Estimate how many bacteria were in the 100 uL of bacteria that you spread on each plate. Explain your logic.
| |
We estimate that there were around 5000 - 10000 bacteria since their were about 15 bacteria colonies in every unit, and those have a multitude of bacteria, and because many bacteria died due to the ampicillin, there are approximately that many bacteria at the beginning of the lab.
| ||
4.
|
What is the role of arabinose in the plates?
| |
The arabinose is a promoter for the GFP gene, and it is needed in order for the RNA polymercase to be allowed to read the GFP gene and express it.
| ||
5.
|
List and briefly explain three current uses for GFP (green fluorescent protein) in research or applied science.
| |
| ||
6.
|
Give an example of another application of genetic engineering.
| |




Thursday, January 21, 2016
Candy Electrophoresis Lab Analysis
All the dyes that were found matched up with reference dyes in color, size, and area in the gel except for the green dye, which split in 2 and had a blue band and a yellow band. This is probably because the color green is created from a combination of those colors. and the mixture was split during the electrophoresis.
The citrus red 2 dye is most similar to the dyes in the lab, specifically red 40, because it has the relatively same structure and size un like the other dyes, which are oddly shaped. Due to the similarities between these dyes, they would probably move at the same rate and to the same area in the gel.
Dog food companies probably put different color dyes in their foods because it might make the food seem more appetizing and the color may attract dogs towards it. Also, the color may give it the artificial look of meat and can make it look better compared to an all natural look.
Dog food companies probably put different color dyes in their foods because it might make the food seem more appetizing and the color may attract dogs towards it. Also, the color may give it the artificial look of meat and can make it look better compared to an all natural look.
The reason people might prefer artificial dyes over natural dyes is because artificial dyes can come in a larger variety and are cheeper to create and process, while natural dyes must be obtained from a natural source and may not have the desired quality or color.
The forces that control the distance tin which the dyes migrate are the size of the pieces of DNA along with the structure of the dye. These two control the distance because if the piece is smaller, then it travels farther and the structure may cause it to be larger or smaller.
The force of the electricity running through the gel moves the dye, which moves them from a negatively charged side to a positively charged size.
The movement caused by the charge distribution allows the DNA to move in little holes in the gel, thus splitting them by size since the smaller particles take less time to move than the larger ones.
The DNA molecules with those weights will separate through the holes, but some will just take longer to migrate. In order of farthest to closest from the starting point it would be: 600, 1000, 2000, with 5000 lagging far behind.

Wednesday, January 13, 2016
Recombinant DNA Lab Analysis
In thus lab, we simulated the process of producing recombinant DNA and how enzymes are used to cut plasmids and genes. In this lab, we tested a multitude of enzymes to see weather they would cut twice in an insuling gene, and once in a the plasmid bacteria. The bacteria was resistant to the antibiotic kanamycin, so I would put the bacteria in kanamycin since the bacteria that had insulin also were resistant to kanamycin, so they could survive and you can mass produce them. I would not use the antibiotics tetracycline and amplicillin since they would kill all the bacteria and the ones with insulin would not survive. Restriction enzymes are enzymes that are able to cut out parts out of DNA. The one we used was Eco R1 since it cut the the human gene in two places close to the insulin gene and cut the plasmid in only one l place. If the restriction enzyme cut the bacteria in more than one place, then the lygase would not know where to attach the insulin gene to. This technology can be important in everyday lives since it can create products that people are unable to produce and provide them with a mass production of cures to diseases they may have. A real life example of recombinant DNA is that scientists have been able to produce plants that are resistant to freezing temperatures and to pesticides.


Tuesday, December 8, 2015
Protein Synthesis Lab Analysis
-
The process of protein synthesis changes DNA into RNA, and then
into proteins. The steps of this include transcription and translation. During
transcription, RNA polymerase binds to the DNA and separates the DNA strands.
RNA polymerase then uses one strand of DNA to as a template and attaches the
corresponding nucleotide to create the strand of RNA. The base thymine is
switched with the base uracil. The new RNA strand then travels from the nucleus to the ribosome. In translation, the ribosome reads the codons
(pairs of 3 bases) to create a specific amino acid, which is then attached to a long
string to create a protein.

Changes in the base pairs of DNA molecules can have a major effect depending on the type of mutation that occurs and where in the DNA sequence it occurs. The 2 types of mutations are point mutations and frameshift mutations. Point mutations can be harmless and may only change one codon, though the amino acid coded is still the same. Frameshift mutations can drastically alter the DNA sequence and change the proteins created. The insertion and deletion of bases change all of the codons after the change and greatly affects which amino acids the codons code for due to them all being changed. A frameshift mutations earlier in the sequence is the most harmful as it has the most codons to change.

The mutation that we chose for our was a deletion of a base near the beginning of the sequence. We chose this mutation since it was a frameshift mutation and we believed that it would cause the most damage. Compared to other mutations, this one changed the most base codons and changed the most amino acids, creating different ones and getting rid of the stop codon. It matters where the mutation occurs because earlier mutations change all the ones behind them and have a greater effect.
One real life mutation that occurs in human organisms is sickle cell anemia, which is the result of point mutation in one of the nucleotides for the protein of hemoglobin. The mutation causes the red blood cells to distort and form clots, greatly endangering the body.

Sunday, December 6, 2015
Human DNA Extraction Lab Conclusion
In this lab we asked the question of "how can DNA be separated from cheek cells in order to study it?" We found that you can separate DNA from cheek cells through the steps of homogenization, lysis, and precipitation, which is where the DNA first becomes visible. Our claim was correct since we used this process to extract DNA, and the DNA came out in creamy white clumps once the alcohol was added on top of the solution, which acted to draw out the precipitate (DNA). Our qualitative data supports our claim since the DNA is supposed to float to the top since it is nonpolar and the alcohol is polar, so it floats the top (precipitation) . The protocol for extracting DNA that we followed properly worked, which allowed us to extract the DNA.
While our hypothesis was supported by our data, there could have been errors due to an incorrect ordering of the lab procedure and improper measurements of liquids and enzymes added to the solution. In the lab, we were required to properly order the steps of the lab according to the steps of DNA protocol. We decided to put soap into the solution before salt, which incorrectly follows the procedure since soap is added to lyse the cell membrane and emulsify the lipids, while salt is used to facilitate precipitation of the DNA, and since lysis comes before precipitation, so our ordering was wrong. This could have had a major effect, as the DNA may have not been properly extracted and we may have not gained enough of the DNA. Improper measurements of solutions could have effected the data since unequal measurements could have changed the solution and the way it effected the DNA. Due to there errors, in future experiments I would recommend that the protocol be given to us beforehand so that everyone follows the same procedure, but is is impossible get rid of the improper measurements due to the chance of human error.
This lab was done to demonstrate how DNA can be extracted from cells and how to create a procedure for labs based off given information. From this lab I learned the three basic steps of DNA extraction (homogenization, lysis, and precipitation), which helps me understand the concepts of how DNA is extracted and how different solutions interact with the molecules within DNA. Based on my experience from this lab, I can apply my knowledge to different labs involving DNA and now know how to create a lab procedure by identifying different given parts and putting them in order.
While our hypothesis was supported by our data, there could have been errors due to an incorrect ordering of the lab procedure and improper measurements of liquids and enzymes added to the solution. In the lab, we were required to properly order the steps of the lab according to the steps of DNA protocol. We decided to put soap into the solution before salt, which incorrectly follows the procedure since soap is added to lyse the cell membrane and emulsify the lipids, while salt is used to facilitate precipitation of the DNA, and since lysis comes before precipitation, so our ordering was wrong. This could have had a major effect, as the DNA may have not been properly extracted and we may have not gained enough of the DNA. Improper measurements of solutions could have effected the data since unequal measurements could have changed the solution and the way it effected the DNA. Due to there errors, in future experiments I would recommend that the protocol be given to us beforehand so that everyone follows the same procedure, but is is impossible get rid of the improper measurements due to the chance of human error.
This lab was done to demonstrate how DNA can be extracted from cells and how to create a procedure for labs based off given information. From this lab I learned the three basic steps of DNA extraction (homogenization, lysis, and precipitation), which helps me understand the concepts of how DNA is extracted and how different solutions interact with the molecules within DNA. Based on my experience from this lab, I can apply my knowledge to different labs involving DNA and now know how to create a lab procedure by identifying different given parts and putting them in order.
Monday, November 16, 2015
Coin Sex Lab Analysis
In this lab, we asked the question of "how is probability used to predict what our offspring will be?" We flipped coins marked with different alleles of genes to simulate Mendel's laws of segregation and assortment and model dihybrid crosses, x -linked inheritance, autosomal dominance crosses, and the sex of offspring. Coins served as a good model for genes because there was a 50% chance of getting either gene, which showed the two laws and used probability to find actual ample sized results. During meiosis, the chromosomes split, which is represented by the flipping of the coin, showing the random probability of having either allele. Through recombination, the genes are combined and we can find the genotype and phenotype of an organism. This results in many pairings, some homozygous and some heterozygous. The phenotypic ratio for dihybrid double heterozygous crosses is 1:3:3:9, with 9 being the phenotype both dominant, the 3's as 1 recessive and 1 dominant, and the 1 being both recessive. Our actual results through the flipping of coins garnered the result of 3:1:2:10. The differences in the results of the data is due to the representation of the Law of Independent Assortment and the random probability of getting any phenotype, though some have higher chances due to dominant and recessive alleles. The limit of probability comes from the randomness of gene separation and the ability for genes to mutate and cross with each other, which creates new, unaccounted alleles. These changes cannot be predicted by punnet squares and probability. This understanding of the probability of crosses can help predict what genes and traits my children will have in the future and what unknown traits I may have right now,
Monday, October 19, 2015
Photosynthesis Virtual Labs Analysis
Photosynthesis Virtual Labs
Lab 1: Glencoe Photosynthesis Lab
Analysis Questions
1. Make a hypothesis about which color in the visible spectrum causes the most plant growth and which color in the visible spectrum causes the least plant growth?
If red, blue and violet are best used by plants, then plants will grow best under these colors.
If green and yellow provide the least energy for plants, then plants will grow worse under these conditions.
2. How did you test your hypothesis? Which variables did you control in your experiment and which variable did you change in order to compare your growth results?
I used the light and plant growth virtual lab and measured the average heights of the plants under the different conditions. In this lab, there was no control lab to compare to, and the independent variable was the color of the light used.
Results:
Filter Color
|
Spinach Avg. Height (cm)
|
Radish Avg. Height (cm)
|
Lettuce Avg. Height (cm)
|
Red
|
18
| ||
Orange
|
14
| ||
Green
|
2
| ||
Blue
|
19
| ||
Violet
|
16
|
3. Analyze the results of your experiment. Did your data support your hypothesis? Explain. If you conducted tests with more than one type of seed, explain any differences or similarities you found among types of seeds.
The data supported our hypothesis as the colors which we predicted would grow plants better had higher average heights and the colors which we predicted would do worse had lower height averages.
4. What conclusions can you draw about which color in the visible spectrum causes the most plant growth?
Colors closer to the end of the visible color spectrum provide more energy and help plants grow better than visible light closer to the middle of the spectrum.
5. Given that white light contains all colors of the spectrum, what growth results would you expect under white light?
I would expect plants under white light to grow the best and have the highest average height because white light contains all the colors in the spectrum and thus has the combined energy of all of them.
Site 2: Photolab
- Question: Does the amount of carbon dioxide present during photosynthesis affect the rate of photosynthesis?
- Hypothesis: If photosynthesis uses carbon dioxide to create glucose, and to gain more of a product you need more of the reactants, then an increase in carbon dioxide levels will increase the rate of photosynthesis.
- Experimental Parameters:
- Dependant Variable: The amount of oxygen released.
- Independent Variable: Level of carbon dioxide in the water.
- Control: Water with a low level of carbon dioxide.
- Constant:
- Temperature: 10
- Light Intensity: 20%
- Data Table
Amount of Oxygen Released
| |||
Time:
|
15s
|
30s
| |
Levels of Carbon Dioxide
|
High
|
4
|
8
|
Low
|
3
|
6
| |
Conclusion
In this lab we asked the question, does the amount of carbon dioxide present during photosynthesis affect the rate of photosynthesis? We found that the amount of carbon affects the rate of photosynthesis. For every 15s in the virtual lab, when there was a low amount of carbon dioxide, only 3 bubbles rose, while the high amount of carbon dioxide caused 4 bubbles. The bubbles are a product of photosynthesis as the oxygen is released and causes a bubble to rise to the top. Also, to create a faster rate of reactions and more products in science, you need a higher amount of reactants, which is why a higher amount of carbon dioxide causes a faster reaction and more product. This data supports our claim because it shows how a higher amount of carbon dioxide increases the reaction and shows the differences caused by varying amounts.
This lab was done to demonstrate the effects of external parameters on the rate of photosynthesis. From this lab I learned how different external environmental changes affect the rate of photosynthesis, which helps me understand the concept of photosynthesis and how an increase in reactants increases the rate and product from a reaction. Based on my experience from this lab, I now know how to design a functional experiment and how to change variables to answer questions.
Subscribe to:
Posts (Atom)